Example: Harris-Förstner Corner Detection
In this section, it is demonstrated how scikit-image can be applied to detect corners. Particularly, the Harris-Förstner approach, which has been introduced in the previous section will be applied.
import numpy as np
from matplotlib import pyplot as plt
from skimage import data, img_as_float, io
from skimage.feature import corner_harris,corner_peaks
from warnings import filterwarnings
filterwarnings("ignore")
im1="../pics/empire.jpg"
im2="../pics/blobs.png"
im3="../pics/gantrycrane.png"
im4="../pics/a4weiss.jpg"
image = img_as_float(io.imread(im4,as_gray=True))
As already stated in the previous section in scikit-image,
one function - corner_harris() - calculates for all pixels the value, given in the left hand side of the unequation,
and a second function - corner_peaks() - applies the threshold \(T\) (default value 0) and a minimum distance \(D_{min}\) to the result of the first function.
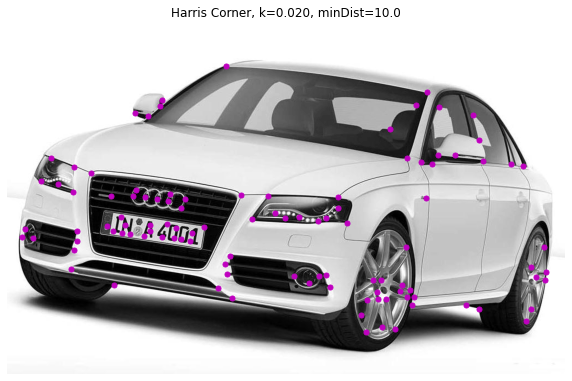
Detected corners are then separated by at least \(D_{min}\) pixels. The influence of varying parameters \(\kappa\) and \(D_{min}\) is demonstrated in the picture below)
M=10 # minimum distance
K=0.02 # Kappa
filtered_coords = corner_peaks(corner_harris(image,k=K),
                               min_distance=M,threshold_abs=0)
#Note that the threshold T (default: T=0) is applied in corner_peaks;
#corner_harris returns det(A)-k*trace(A)**2 for all pixels
plt.figure(figsize=(10,20))
plt.imshow(image,cmap = plt.cm.gray)
y, x = np.transpose(filtered_coords)
print(x.shape)
plt.plot(x, y, 'm.',ms=10)
plt.axis('off')
plt.title("Harris Corner, k=%1.3f, minDist=%2.1f"%(K,M))
plt.show()
(107,)
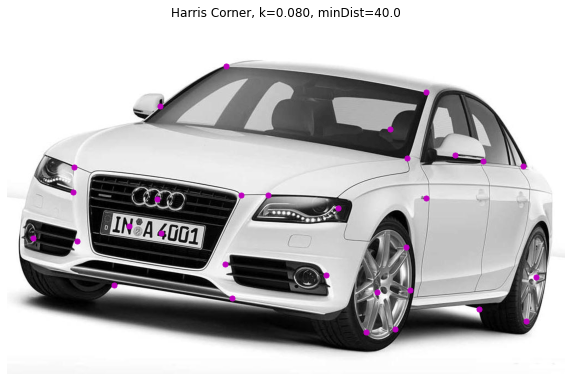
Next, the value for \(\kappa\) is increased, i.e. less corners are detected:
M=40
K=0.08
filtered_coords = corner_peaks(corner_harris(image,k=K),min_distance=M)
plt.figure(figsize=(10,20))
plt.imshow(image,cmap = plt.cm.gray)
y, x = np.transpose(filtered_coords)
print (x.shape)
plt.plot(x, y, 'm.',ms=10)
plt.axis('off')
plt.title("Harris Corner, k=%1.3f, minDist=%2.1f"%(K,M))
plt.show()
(31,)